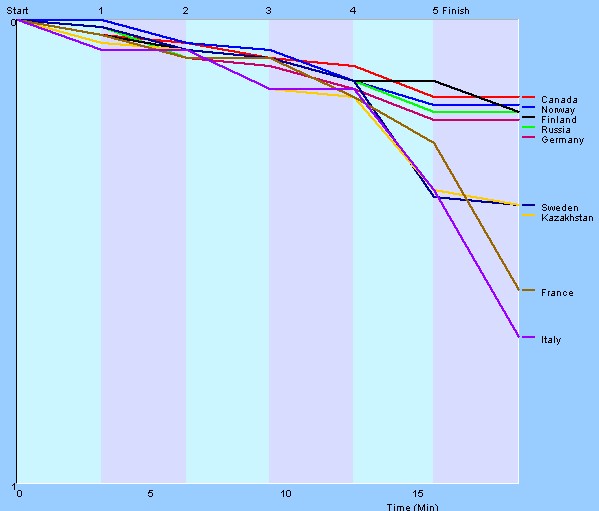
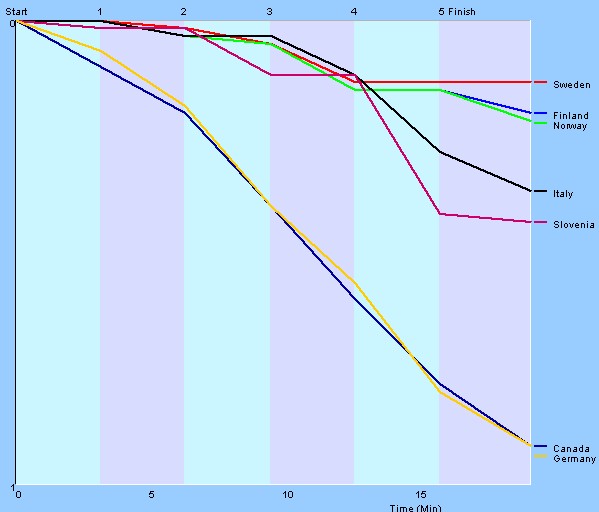
Race development graphs: Team Sprint World Champs 2011
Posted by Jan Kocbach, 02 Mar 2011@15:16
Fantastic finish by Canada in the mens team sprint – here you can see a graphical representation of the race development for the team sprints. Sweden took the victory among the women after excellent races on the two last legs. Follow the links below to see the interactive race development graphs.
Some quick observations:
- Men: Except for Finland loosing a lot of time on the last leg, it was all decided on the second last leg. The second Petter Northug lost on the second last leg was the same second Vigen Hattestad was behind in the end.
- Men: Everybody was close together after 4 legs – Sweden, France, Kazakhstan and Italy lost a lot of time on the two last legs.
- Women: Slovenia was up there after four legs after great performance by Majdic, but lost a lot on the second last leg. Italy also lost a lot on the last two legs.
Here are the interactive graphs:
Comments Off


