Gällivare 15/10km Race Development: Graphical Analysis
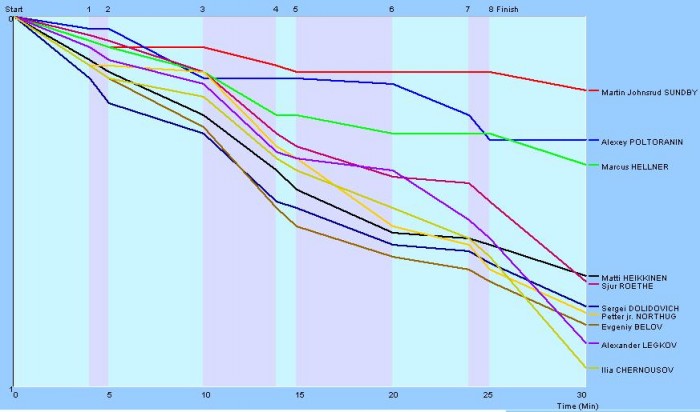
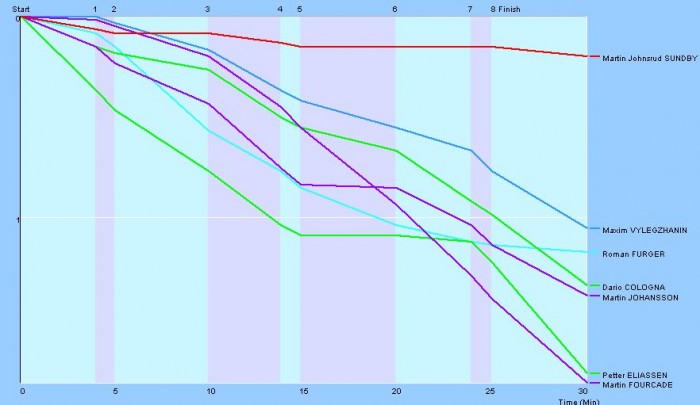
Martin Johnsrud Sundby – previously considered a classic specialist – did a fantastic race on today’s 15 km free in Gällivare. Sundby was fastest on 5 of the splits – especially in the second part of the race the Norwegian skier dominated as you can see from the graphical race analysis above.
The only one being more impressive in the last part of the men’s race than Sundby was Alexey Poltoranin who had a very strong finish from 12.3 km to 15 km.
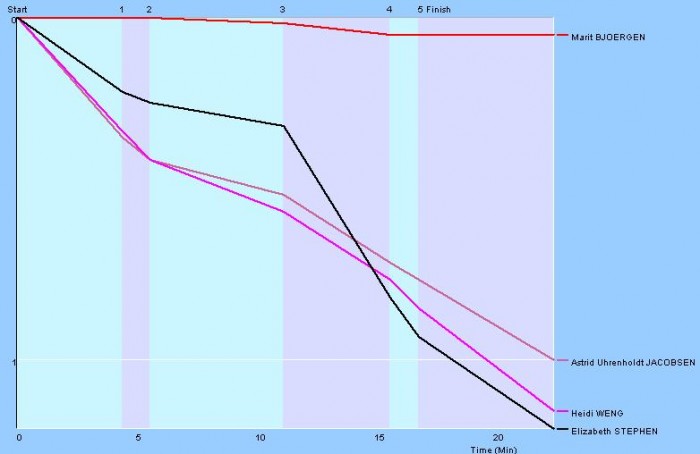
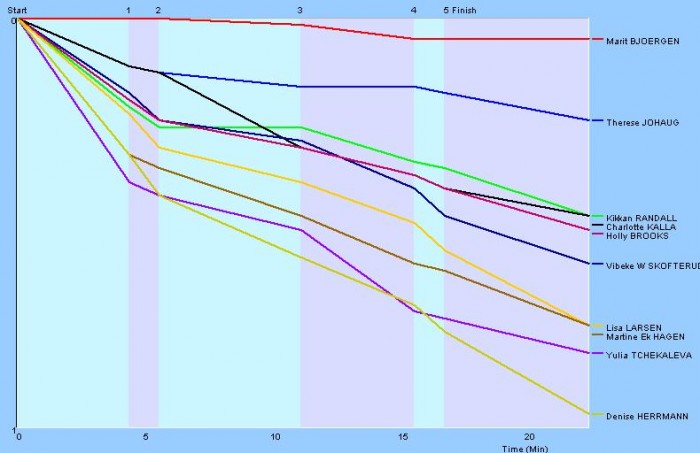
Below graphical splits analysis is shown for some selected skiers – corresponding curves are also shown for the women.
Interactive graphical splits analysis can be found here:

